



Field Service Statistics to Know in 2027
Field service is under pressure to do more with limited capacity. Customer expectations are rising, experienced technicians are harder to replace, and AI investment is accelerating.
But the latest research points to a persistent gap: organizations are adopting new tools faster than they are preparing people and systems to use them well.
The statistics below come from research published in 2026. Some are survey findings; others are operational benchmarks based on service records collected over several years.
Because the studies use different samples and methods, they are best used as directional benchmarks, not direct comparisons.
FIELD SERVICE BENCHMARKS:
First-time fix rate, resolution time, and service cost
Aquant’s 2026 Field Service KPI Benchmark analyzed nearly 30 million service events across 161 organizations, covering 7 million assets and $8.3 billion in service costs over three years. Its findings show how much performance can vary across service teams.
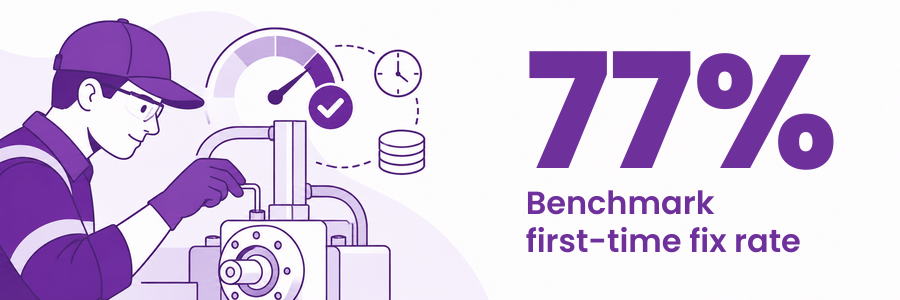
- The benchmark first-time fix rate is 77%. Top performers reach 88%, while the lowest-performing group averages 60%.
- Average time to resolution is 4.5 days. Top performers average 2.5 days; lower performers average 10 days.
- Failed visits account for 25% of service costs at the median. That rises to 44% for lower performers and falls to 14% for top performers.
- Aquant estimates that one in five cases could be resolved remotely. Its analysis puts the potential service-cost impact at 1.4% for top performers and 18.3% for lower performers.
- In Aquant’s model, improving performance toward top-team levels could reduce service costs by up to 26% in some segments. This is a modeled opportunity, not a guaranteed result.
- Top-performing companies retain 87% of employees, compared with 66% among lower performers.

FIELD SERVICE AI ADOPTION:
Use cases, ROI, and implementation barriers
Salesforce’s 2026 State of Field Service research surveyed 2,317 field service professionals across nine countries. The report finds widespread AI use, alongside ongoing challenges with training, access to information, and disconnected systems.
- 95% of field service organizations say they use AI, and 85% plan to increase AI investment over the next one to two years.
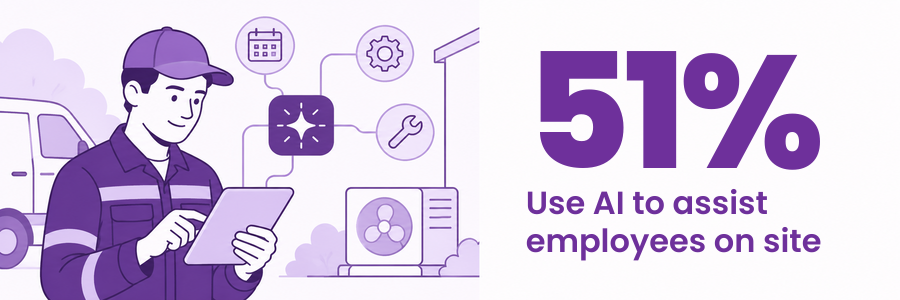
- 51% use AI to assist employees working in the field.
- 85% of leaders say they have measured the ROI of AI investments. Reported benefits include higher mobile worker productivity (43%), improved customer satisfaction (40%), and fewer safety incidents (34%).
- Among organizations using AI-powered scheduling and dispatch, 57% report higher revenue per job.
- Only 16% say field and back-office technology are united on a single platform. 52% still use spreadsheets and 43% rely on manual or paper logs.
- 40% say they struggle to measure whether their AI is working.
- 66% report that mobile-worker turnover increased over the past two years. Salesforce identifies insufficient training or support when new technology is introduced as the leading turnover driver.
- 61% say mobile workers have limited access to the customer data they need.
FIELD SERVICE TECHNICIAN SHORTAGE:
Retention, training, and daily frustrations
A separate 2026 State of Field Service report from TrueContext and Field Service Next surveyed 100 senior field service leaders. Its findings suggest that AI programs are advancing while integration and workforce constraints remain.
- 68% say their organization has moved AI adoption beyond pilots into formal deployment.
- 48% cite legacy-system integration as a major barrier to return on investment.
- 45% identify technician shortages as a barrier to growth.
- 53% plan to implement AR or VR for technician support.
- 69% say proactive maintenance now outpaces reactive service.
- Only 17% operate field service as a true profit center with P&L accountability.

ServiceTrade’s 2026 Technician Insights report drew on responses from more than 800 technicians in commercial service. The results put day-to-day coordination and job quality alongside pay as factors in the technician experience.
- 45% cite miscommunication as a major frustration, and 44% cite inefficient scheduling.
- Pride in the work ranks among technicians’ top motivations (55%), followed by problem-solving (51%) and hands-on work (51%). Pay was cited by 30%.
- About 28% say they use AI at work, regularly or occasionally. Among those technicians, 46% use it to save time on paperwork, writing, or summarization.
Technician shortages are limiting growth and customer service across agriculture and construction equipment dealerships.
The AED Foundation’s 2026 report estimates dealers need 10,000 diesel technicians each year, and 80% say they cannot meet customer demand because they cannot find qualified workers.
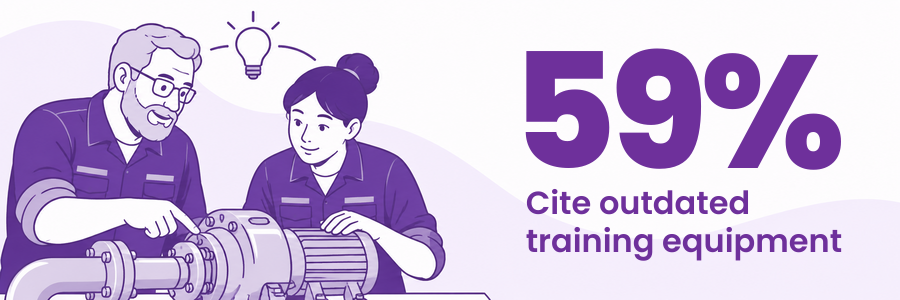
Training capacity is part of the problem: among U.S. vocational schools surveyed, 63% cite insufficient funding, 59% outdated training equipment, and 51% a shortage of qualified instructors.
Retention adds pressure: 52% of dealers say technician turnover peaks in the 2-to-5-year range, when workers are fully trained and highly productive.
These findings are specific to the agriculture and construction equipment sector.
FIELD SERVICE TRENDS:
Remote support, automation, and rising demand
ISG’s 2026 Field Services Report surveyed 200 decision-makers at large enterprises, mainly in the Americas and Europe. The study focuses on onsite and physical technology support across enterprise locations.
- 56% expect AI infrastructure or AI-enabled devices to drive additional field service demand through 2028.
- Respondents expect the share of incidents resolved without human intervention to rise from 14% today to 25% by the end of 2028.
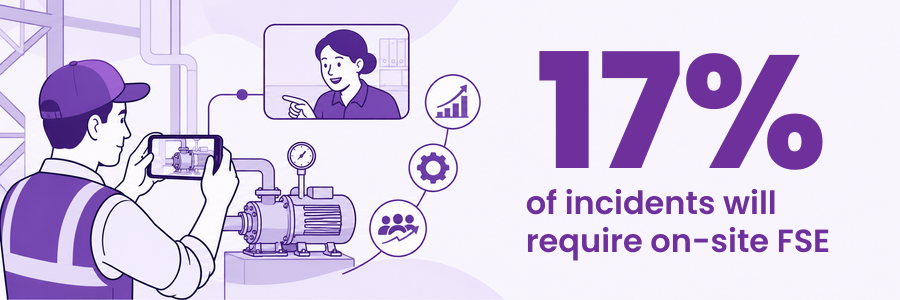
- They expect incidents requiring an onsite technician to fall from nearly 29% to 17% over the same period. The remaining work is expected to involve more specialized, time-sensitive support.
What field service leaders can learn from these statistics
The numbers point to a few practical priorities for service leaders:
- Reduce repeat work. First-time fix and failed-visit benchmarks show how strongly troubleshooting quality affects cost and resolution time.
- Make expertise easier to access. AI adoption is high, but many workers still lack customer context, training, or reliable access to information.
- Connect the systems technicians use. The data suggests that disconnected records and manual processes make it harder to coordinate work and measure results.
- Treat remote support as part of the service model. Some cases can be handled without a site visit, while more complex work still requires skilled technicians.
- Prepare people alongside technology. Adoption alone does not show whether a tool helps technicians do the work or improves service outcomes.
Field service teams are being asked to improve productivity, protect customer experience, and scale expertise as the work changes.
The useful question is not just which technology to add. It’s whether technicians can get the context, guidance, and support they need when the work is happening.